
An LLM confidence score is useful only after you define what it predicts, keep the measurement protocol fixed, and test it against labeled outcomes from your own task. A self-reported “90%,” a token log probability, and nine matching answers from ten samples are three different signals. None gives you a universal 0.9 probability that an answer is correct.
Audience: Intermediate — product engineers, data teams, and technical leads who need an LLM to answer, escalate, or abstain.
Treat the raw number as a feature, not a decision. Calibrate it on a held-out set, inspect how error changes as you reject low-scoring answers, and put deterministic controls around any action that can move money, expose data, or change production state.
What does an LLM confidence score measure?
An LLM confidence score is a numeric signal intended to rank or estimate the reliability of a model output. Its meaning depends on how it was produced.
For a score to act like a calibrated probability, outputs assigned 0.8 should be correct about 80% of the time on the same kind of work. That statement needs four details:
Remove any one of those details and “0.8 confidence” becomes ambiguous. It may mean the model found the wording likely, repeated itself consistently, followed an instruction to print a number, or ranked one answer above alternatives. Those properties can correlate with correctness. They are not correctness itself.
Calibration also differs from discrimination. A score has good discrimination when correct answers usually rank above incorrect ones. It has good calibration when the numeric values match observed frequencies. A system can be useful for ranking while its percentages are wrong, or show reasonable average calibration while failing to separate right from wrong answers.
Three signals are commonly called confidence
| Signal | What it actually observes | Main advantage | Main failure mode |
|---|---|---|---|
| --- | --- | --- | --- |
| Verbalized confidence | A number the model generates in text | Works with black-box chat APIs | Sensitive to prompt, format, and answer provenance |
| Token log probabilities | Conditional likelihood of generated tokens | Cheap when the API exposes logprobs | Measures sequence likelihood, not truth |
| Repeated-sample agreement | How often sampled answers agree semantically | Works without model internals | Costs more and can be consistently wrong |
Choosing between them is an engineering decision. Combining them can help, but an ensemble still needs evaluation on the target task.
Verbalized confidence is an elicited answer
The easiest approach is to ask:
Return your answer and the probability that it is correct from 0 to 1.This works with almost any model. It also makes the confidence value part of the generation. Prompt wording, response scale, supplied context, and whether the model produced the answer itself can change the result.
A 2026 study tested three open 7–8B base/instruction-tuned model families on four question-answering benchmarks. The researchers held the verbal-confidence prompt fixed while changing which answer was scored, which answer tokens supplied the token score, and which context preceded those tokens. Changing the conditioning context moved the verbal-versus-token calibration comparison more than changing the calibration estimator, and flipped which signal looked better in 9 of 12 instruction-tuned settings under both ECE and Brier-score comparisons. When models scored supplied answers, plausible wrong answers received almost the same verbal confidence as correct supplied answers. The authors therefore describe both signals as protocol-dependent behavioral measurements, not direct readouts of uncertainty (Kim and Kang, 2026).
That result does not prove every verbal score is useless. It shows why a prompt such as “be honest about your confidence” cannot substitute for a calibration set.
Token logprobs measure next-token likelihood
A log probability records how likely a token was under the model’s conditional generation distribution. OpenAI’s documentation defines it as the probability of a token at a particular position given the preceding context; sequence log probabilities can be summed for scoring or ranking (OpenAI Cookbook). Google’s GenerateContent response likewise exposes average candidate log probabilities and token-level logprob results when the selected API and model support them (Gemini API reference).
This is valuable for a closed choice such as `approve` versus `reject`. You can collect the probability mass assigned to the allowed labels and then calibrate that score. It is much harder to interpret a long free-form answer. Tokenization, answer length, paraphrasing, and the conditioning prompt all affect the sequence likelihood.
A fluent false statement can have high likelihood. A correct but unusual name can have low likelihood. The score answers “How expected was this token sequence here?” It does not automatically answer “Is the claim true?”
Repeated sampling measures agreement
Sampling the model several times gives a black-box consistency signal. If eight of ten responses express the same answer, the empirical agreement score is 0.8. Free-form responses usually need semantic clustering so that paraphrases count as the same answer.
This signal often carries more information than a single self-report, but it has two costs. First, ten generations cost roughly ten times as many output calls before batching, caching, or shorter prompts change the arithmetic. Second, agreement can be confidently wrong when the model repeats the same misconception.
Recent research makes both points visible. One July 2026 paper compared verbal confidence, a logit-based verifier, and a sampling-based method called SliCK on short factual and multi-hop question answering. In that setting, SliCK achieved lower calibration error and better correct-versus-incorrect ranking than the other two methods. It still violated an entailment-based probability consistency test on 31% of evaluated cases. The study relied on semantic clustering by an LLM judge, short-answer benchmarks, one main model plus smaller cross-model subsets, and an assumption that sampling frequency reflects belief (Matta, Naphade, and Zou, 2026).
The practical interpretation is narrower than “sampling solves confidence.” Agreement is a useful raw signal. It remains a signal that must be checked against outcomes.
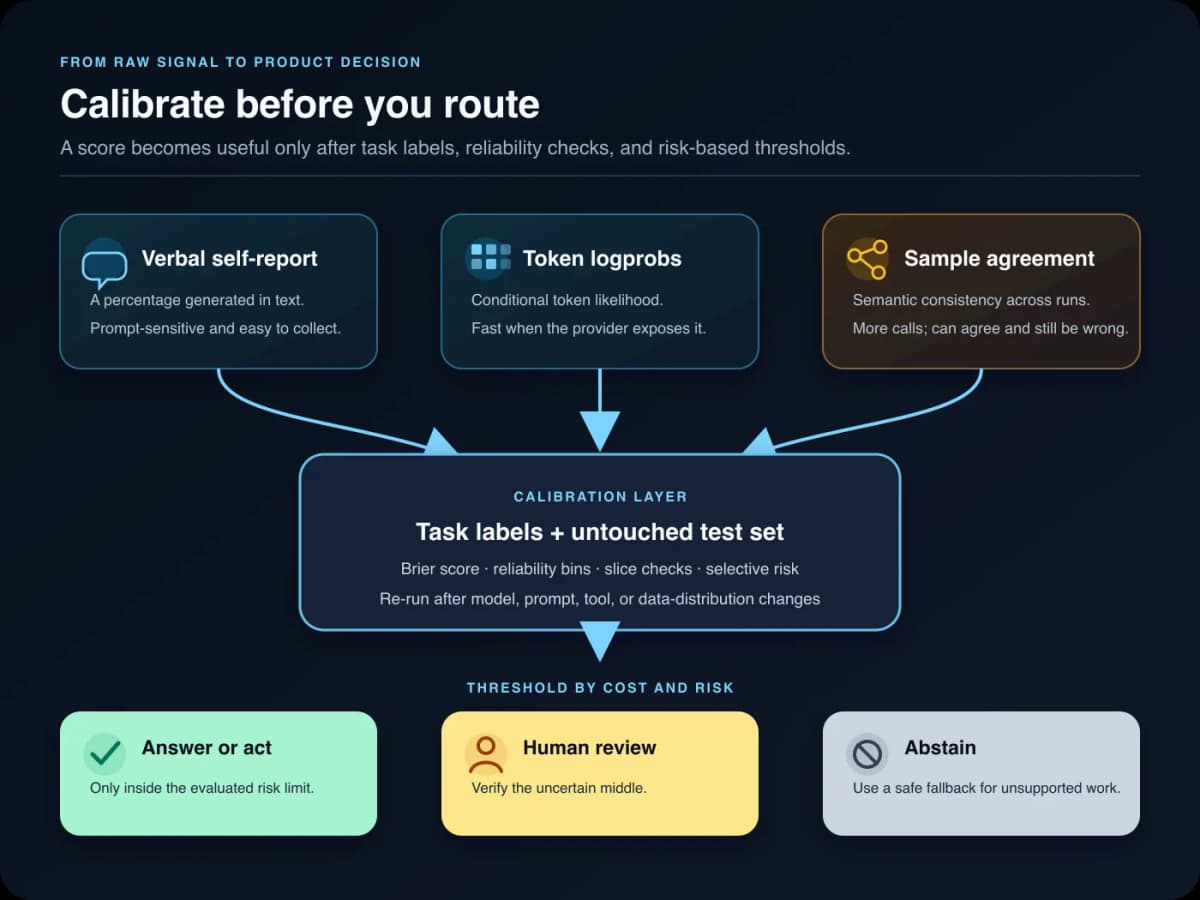
*A production threshold belongs after task-specific labels and calibration checks, not directly after the model output.*
Why a plausible confidence number can still mislead
Three recent results should change how teams read a percentage beside an LLM answer.
Accuracy and calibration can move separately
ConfidenceBench evaluated prompted probabilities from 15 frontier models on 200 private English multiple-choice questions across spatial reasoning, high-precision mathematics, word lookup, and unknowable questions. Each model answered the set three times. The benchmark used Brier score, which penalizes the squared distance between a reported probability and the binary outcome.
The model ranking by calibration did not simply reproduce the ranking by accuracy. The authors report a best Brier score of 0.103, while some evaluated systems scored worse than a calibrated random four-choice baseline of 0.1875. The benchmark is deliberately small, private, English-only, and multiple-choice. Its verbal scores may reflect instruction following and prompt framing, so the numbers should not be generalized to long-form or multi-turn work (ffrench-Constant et al., 2026).
Measure calibration directly. Do not infer it from a model’s overall benchmark accuracy.
The measurement protocol can change the conclusion
The score is attached to a specific pipeline. If a team changes the prompt, model snapshot, answer format, candidate labels, context window, temperature, or logprob aggregation, it has changed the measurement instrument.
Record those choices with every evaluation result. Raw code-agent activity metrics also need system and evaluation context before they say anything about reliability. If the prompt or model changes, recalibration is a release check, not optional cleanup.
A calibrated score can still fail on a slice
An average can hide failure on one language, product, customer segment, document type, or answer length. A support classifier may look calibrated overall because common billing questions dominate the test set, while rare security tickets remain overconfident.
Always inspect slices with enough examples to support a conclusion. Where samples are sparse, report the uncertainty instead of treating a noisy rate as fact.
A reproducible LLM confidence calibration workflow
The following workflow is deliberately small. It can be run before adopting a larger uncertainty framework.
1. Define the event and the action
Write one sentence that completes this template:
Examples:
Avoid events such as “the answer is good.” They cannot be labeled consistently.
For actions with irreversible effects, confidence must not replace authorization. A model may help choose a path, but AI agent permissions should still enforce allowed resources, arguments, approval rules, and receipts.
2. Build a task-specific holdout set
Collect representative inputs that were not used to tune the prompt or calibration mapping. Include:
Label correctness with a deterministic verifier where possible. For subjective tasks, use a written rubric and adjudication. A confidence score cannot be more defensible than its outcome labels.
Start with enough data to reveal gross miscalibration, then expand around important slices and thresholds. A tiny benchmark can guide exploration, but it cannot justify a high-stakes production threshold.
3. Capture the raw signal without changing the protocol
Store:
Do not round before evaluation. A model that emits only `0.7`, `0.8`, and `0.9` needs to be assessed as three coarse buckets, not presented as precise probability measurement.
4. Calculate Brier score and a reliability table
For binary correctness, the Brier score is:
mean((confidence - outcome)²)Lower is better, but the number needs a baseline and a comparable dataset. A reliability table makes the error easier to see: group similar scores, then compare each group’s average score with its observed accuracy.
This dependency-free Python script reads `id,score,correct` from a CSV file:
import csv

with open("predictions.csv", newline="") as source:
    rows = [
        (float(row["score"]), int(row["correct"]))
        for row in csv.DictReader(source)
    ]

if not rows:
    raise SystemExit("predictions.csv has no rows")

brier = sum((score - correct) ** 2 for score, correct in rows) / len(rows)
print(f"Brier score: {brier:.4f}")

bin_count = 10
bins = [[] for _ in range(bin_count)]

for score, correct in rows:
    if not 0 <= score <= 1 or correct not in (0, 1):
        raise ValueError("score must be 0..1 and correct must be 0 or 1")
    index = min(int(score * bin_count), bin_count - 1)
    bins[index].append((score, correct))

print("range,count,mean_score,accuracy,gap")
for index, values in enumerate(bins):
    if not values:
        continue
    mean_score = sum(score for score, _ in values) / len(values)
    accuracy = sum(correct for _, correct in values) / len(values)
    lower = index / bin_count
    upper = (index + 1) / bin_count
    print(
        f"{lower:.1f}-{upper:.1f},{len(values)},"
        f"{mean_score:.3f},{accuracy:.3f},{mean_score - accuracy:+.3f}"
    )
The table is descriptive. Bin boundaries can change ECE-style summaries, especially on small sets. Keep Brier score, a reliability view, and an action-focused metric together rather than optimizing one chart.
5. Choose thresholds from risk and coverage
A threshold of 0.8 has no universal meaning. Evaluate what happens when the system accepts only outputs at or above each candidate threshold:
print("threshold,coverage,accepted_accuracy")
for threshold in (0.5, 0.6, 0.7, 0.8, 0.9):
    accepted = [
        correct for score, correct in rows
        if score >= threshold
    ]
    coverage = len(accepted) / len(rows)
    accuracy = sum(accepted) / len(accepted) if accepted else float("nan")
    print(f"{threshold:.1f},{coverage:.3f},{accuracy:.3f}")
This creates a basic risk–coverage view. Raising the threshold may reduce errors among accepted cases, but it also sends more work to fallback handling. Pick a threshold from the cost of false acceptance, false rejection, review, latency, and user harm.
Use at least three outcomes when the product supports them:
6. Test drift and protocol changes
Run the holdout after:
Repeated sampling and deeper reasoning also add compute. The tradeoff belongs in the evaluation: compare the error reduction with latency and token cost, rather than assuming more reasoning tokens are always worth buying.
Which confidence method should you use?
| Situation | Start with | Verify before deployment |
|---|---|---|
| --- | --- | --- |
| Closed-label classification with logprobs | Probability mass over allowed labels | Calibration, class imbalance, prompt and label-token sensitivity |
| Black-box short-answer QA | Repeated sampling plus semantic agreement | Consistently wrong answers, clustering errors, added cost |
| One-call latency constraint | Raw score plus a learned calibration mapping | Drift, slice performance, mapping retraining |
| Long-form answers | Claim-level support and uncertainty checks | Completeness, citation quality, unsupported confident claims |
| Irreversible tool action | Deterministic policy and human approval where needed | Never authorize the action from confidence alone |
Open-source libraries can reduce implementation work. UQLM, for example, exposes black-box consistency, white-box token-probability, judge, ensemble, and long-text scorers. Its documentation also makes the latency and access tradeoffs explicit: consistency methods need more calls, while white-box methods require logprobs (UQLM documentation). The repository was still receiving releases in July 2026, including v0.6.4 fixes, which is a stronger maintenance signal than lifetime stars alone (UQLM v0.6.4).
A library supplies estimators. It does not supply the labels, task definition, risk tolerance, or production monitoring that make a threshold defensible.
What the current research does not establish
The cited studies do not prove that one method wins across all LLM applications.
Research can identify candidate signals. Validate the complete system on the work it will actually perform.
Frequently asked questions
Are LLM confidence scores accurate?
Sometimes they correlate with correctness, but accuracy depends on the model, task, scoring method, prompt, and evaluation distribution. Treat an uncalibrated score as a ranking feature. Test it against labeled outcomes before interpreting it as a probability.
Are token logprobs the same as confidence?
No. A token logprob is the conditional likelihood of a token given its context. It can support a confidence estimate, especially for closed-label tasks, but it is not automatically the probability that a free-form answer is factually correct.
What LLM confidence threshold should I use?
There is no universal threshold. Choose one from a held-out risk–coverage analysis that reflects the cost of wrong acceptance, manual review, abstention, and missed automation. Revalidate it after model, prompt, or data-distribution changes.
Claim checks
| Claim | Status | Evidence and qualification |
|---|---|---|
| --- | --- | --- |
| Verbal confidence and token probability are protocol-dependent measurements | Verified | Kim and Kang varied answer provenance, token readout, conditioning context, and estimator across open model families and QA datasets. |
| Conditioning context flipped the preferred signal in 9 of 12 instruction-tuned settings under ECE and Brier comparisons | Verified | Reported in the multi-metric analysis of *Asking Is Not Enough*. |
| Logprobs measure conditional token likelihood | Verified | OpenAI and Google API documentation define token/candidate log-likelihood fields. |
| Sampling agreement can outperform single self-reports on short factual QA | Qualified | SliCK did so in the reported 2026 experiments; the result is not universal and depends on clustering and sampling assumptions. |
| SliCK violated an entailment consistency test in 31% of evaluated cases | Verified | Reported by *Rethinking Uncertainty Evaluation in Large Language Models*. |
| Accuracy does not determine calibration | Verified | ConfidenceBench reports rankings and Brier scores that do not simply track model accuracy. |
| ConfidenceBench’s best reported Brier score was 0.103 | Verified | The result is the mean across three runs on its private 200-question benchmark, not a general model score. |
| A Brier score is the mean squared error between probability and binary outcome | Verified | ConfidenceBench defines the binary Brier score used in its evaluation. |
| UQLM was actively maintained in July 2026 | Verified | GitHub release v0.6.4 was published on July 26, 2026. |
| A production threshold must be task-specific | Qualified | This is the practical interpretation of the protocol-sensitivity and calibration evidence, not a universal theorem about every application. |